ProShares Ultra S&P500 (SSO) - Stock & Dividends
Exchange: USA Stocks • Country: USA • Currency: USD • Type: Etf • ISIN: US74347R1077 • Trading--Leveraged Equity
The ProShares Ultra S&P500 (NYSE ARCA:SSO) utilizes financial instruments chosen by its advisors to attain daily returns aligned with the Daily Target. The index it tracks represents the performance of the U.S. large-cap stock market. It is composed of 500 businesses and real estate investment trusts in the U.S., selected based on factors like liquidity, price, market capitalization, financial viability, and public float. This fund is considered non-diversified.
For more information about ProShares Ultra S&P500, you can visit their website at http://www.proshares.com. The fund is based in the United States.
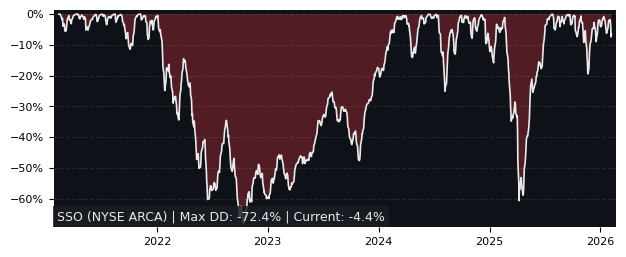
Drawdown (Underwater) Chart
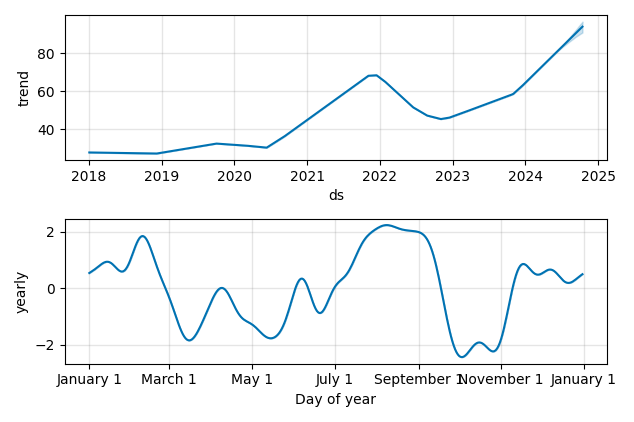
Overall Trend and Yearly Seasonality
SSO ETF Overview
| Market Cap in USD | 4,124m |
| Category | Trading--Leveraged Equity |
| TER | 0.91% |
| IPO / Inception | 2006-06-19 |
SSO ETF Ratings
| Growth 5y | 6.75 |
| Fundamental | - |
| Dividend | 6.86 |
| Rel. Performance vs Sector | 1.51 |
| Analysts | - |
| Fair Price Momentum | 73.53 USD |
| Fair Price DCF | - |
SSO Dividends
| Yield 12m | 0.40% |
| Yield on Cost 5y | 0.96% |
| Dividends CAGR 5y | 13.45% |
| Payout Consistency | 83.2% |
SSO Growth Ratios
| Growth 12m | 45.78% |
| Growth Correlation 12m | 64% |
| Growth Correlation 3m | 17% |
| CAGR 5y | 18.85% |
| Sharpe Ratio 12m | 1.77 |
| Alpha vs SP500 12m | -0.99 |
| Beta vs SP500 5y weekly | 2.03 |
| ValueRay RSI | 40.92 |
| Volatility GJR Garch 1y | 32.63% |
| Price / SMA 50 | -0.72% |
| Price / SMA 200 | 15.83% |
| Current Volume | 3137k |
| Average Volume 20d | 4762.3k |
External Links for SSO ETF
News
Wall Street Journal • Benzinga • Yahoo Finance
Tweets
X (Twitter) • Stocktwits
Fund Manager Positions
Dataroma • Stockcircle
Wall Street Journal • Benzinga • Yahoo Finance
Tweets
X (Twitter) • Stocktwits
Fund Manager Positions
Dataroma • Stockcircle
What is the price of SSO stocks?
As of May 05, 2024, the stock is trading at USD 73.46 with a total of 3,136,975 shares traded.
Over the past week, the price has changed by +1.03%, over one month by -3.84%, over three months by +5.49% and over the past year by +48.93%.
As of May 05, 2024, the stock is trading at USD 73.46 with a total of 3,136,975 shares traded.
Over the past week, the price has changed by +1.03%, over one month by -3.84%, over three months by +5.49% and over the past year by +48.93%.
What is the forecast for SSO stock price target?
According to ValueRays Forecast Model, SSO ProShares Ultra S&P500 will be worth about 84.2 in May 2025. The stock is currently trading at 73.46. This means that the stock has a potential upside of +14.59%.
According to ValueRays Forecast Model, SSO ProShares Ultra S&P500 will be worth about 84.2 in May 2025. The stock is currently trading at 73.46. This means that the stock has a potential upside of +14.59%.
| Issuer | Forecast | Upside |
|---|---|---|
| Wallstreet Target Price | - | - |
| Analysts Target Price | - | - |
| ValueRay Target Price | 84.2 | 14.6 |