Merchants Bancorp (MBIN) - Stock Price & Dividends
Exchange: USA Stocks • Country: United States • Currency: USD • Type: Common Stock • ISIN: US58844R1086
Merchants Bancorp is a diverse bank holding company based in the United States. They operate across several segments including Multi-family Mortgage Banking, Mortgage Warehousing, and Banking.
The Multi-family Mortgage Banking division specializes in government sponsored mortgages, bridge financing for housing projects, construction lending for healthcare facilities, and offers tailored loan products for skilled nursing and memory care facilities, among others. They also serve as a tax credit equity syndicator.
The Mortgage Warehousing arm provides funding for a variety of residential and commercial loans, catering to both agency eligible loans and non-depository financial institutions.
In addition, the Banking segment delivers a wide array of financial services to both individuals and businesses, encompassing retail banking, commercial and agricultural lending, residential mortgage banking, and small business administration loans.
Founded in 1990, Merchants Bancorp is headquartered in Carmel, Indiana. For more information, visit their website at https://www.merchantsbancorp.com.
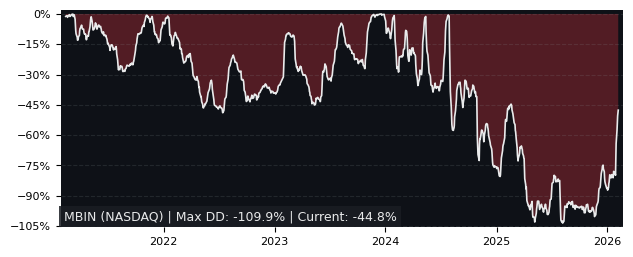
Drawdown (Underwater) Chart
MBIN Stock Overview
| Market Cap in USD | 1,697m |
| Sector | Financial Services |
| Industry | Banks - Regional |
| GiC SubIndustry | Thrifts & Mortgage Finance |
| TER | 0.00% |
| IPO / Inception | 2017-10-27 |
MBIN Stock Ratings
| Growth 5y | 7.12 |
| Fundamental | 0.08 |
| Dividend | 7.39 |
| Rel. Performance vs Sector | 2.60 |
| Analysts | 4.50/5 |
| Fair Price Momentum | 43.09 USD |
| Fair Price DCF | 109.19 USD |
MBIN Dividends
| Yield 12m | 0.85% |
| Yield on Cost 5y | 2.12% |
| Dividends CAGR 5y | 11.37% |
| Payout Consistency | 100.0% |
MBIN Growth Ratios
| Growth 12m | 69.97% |
| Growth Correlation 12m | 67% |
| Growth Correlation 3m | -25% |
| CAGR 5y | 20.17% |
| Sharpe Ratio 12m | 1.89 |
| Alpha vs SP500 12m | 47.70 |
| Beta vs SP500 5y weekly | 0.91 |
| ValueRay RSI | 28.82 |
| Volatility GJR Garch 1y | 31.34% |
| Price / SMA 50 | -5.29% |
| Price / SMA 200 | 11.04% |
| Current Volume | 61.4k |
| Average Volume 20d | 108.1k |
External Links for MBIN Stock
Wall Street Journal • Benzinga • Yahoo Finance
Tweets
X (Twitter) • Stocktwits
Fund Manager Positions
Dataroma • Stockcircle
As of April 27, 2024, the stock is trading at USD 39.04 with a total of 61,387 shares traded.
Over the past week, the price has changed by -0.28%, over one month by -4.43%, over three months by -10.06% and over the past year by +66.67%.
According to ValueRays Forecast Model, MBIN Merchants Bancorp will be worth about 46.5 in April 2025. The stock is currently trading at 39.04. This means that the stock has a potential upside of +19.21%.
| Issuer | Forecast | Upside |
|---|---|---|
| Wallstreet Target Price | 54 | 38.3 |
| Analysts Target Price | 39.5 | 1.18 |
| ValueRay Target Price | 46.5 | 19.2 |